| |
| FY 17-18 |
Q1 |
H1 |
9M |
FY |
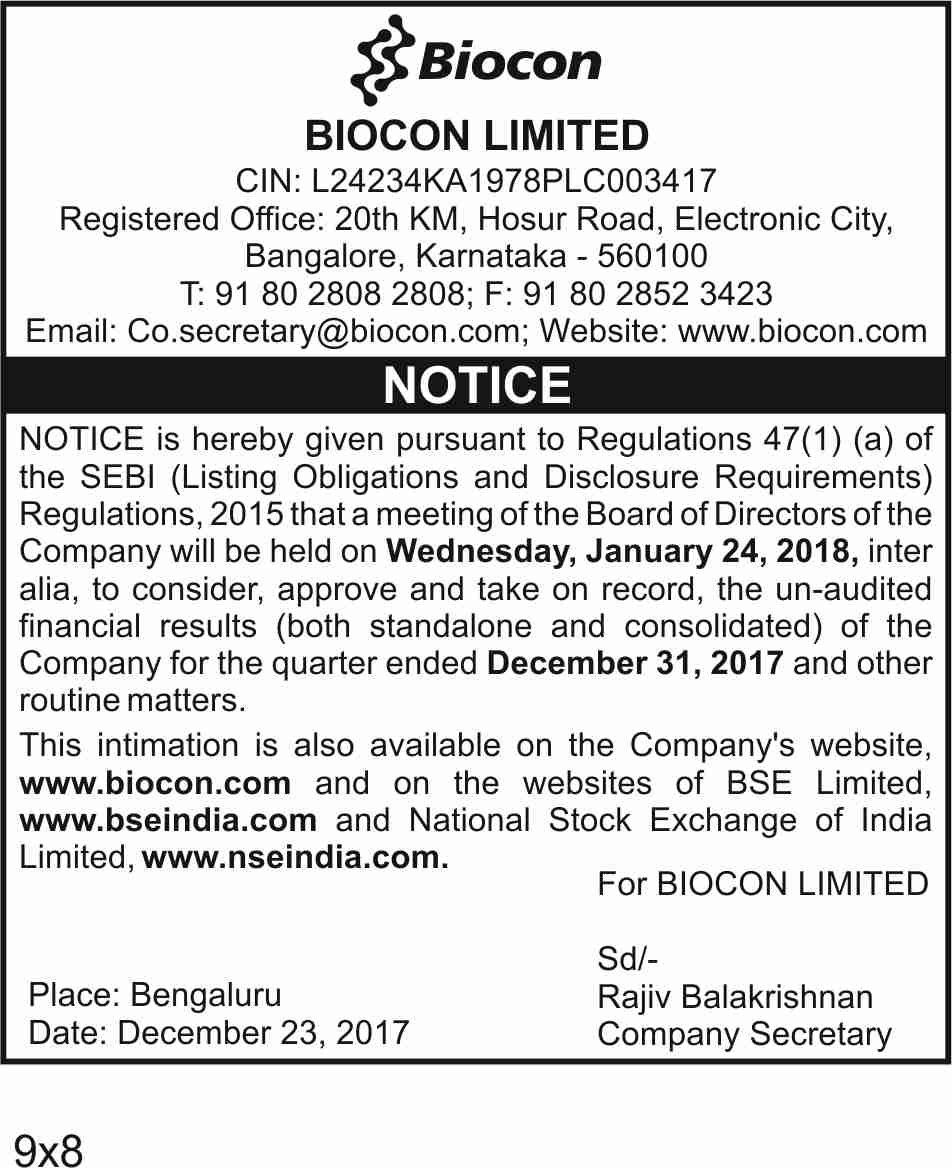
| Notice Ad |
 |
|
|
|
| Press Release |
|
|
|
|
| Fact Sheet |
|
|
|
|
| Transcript of the Call |
|
|
|
|
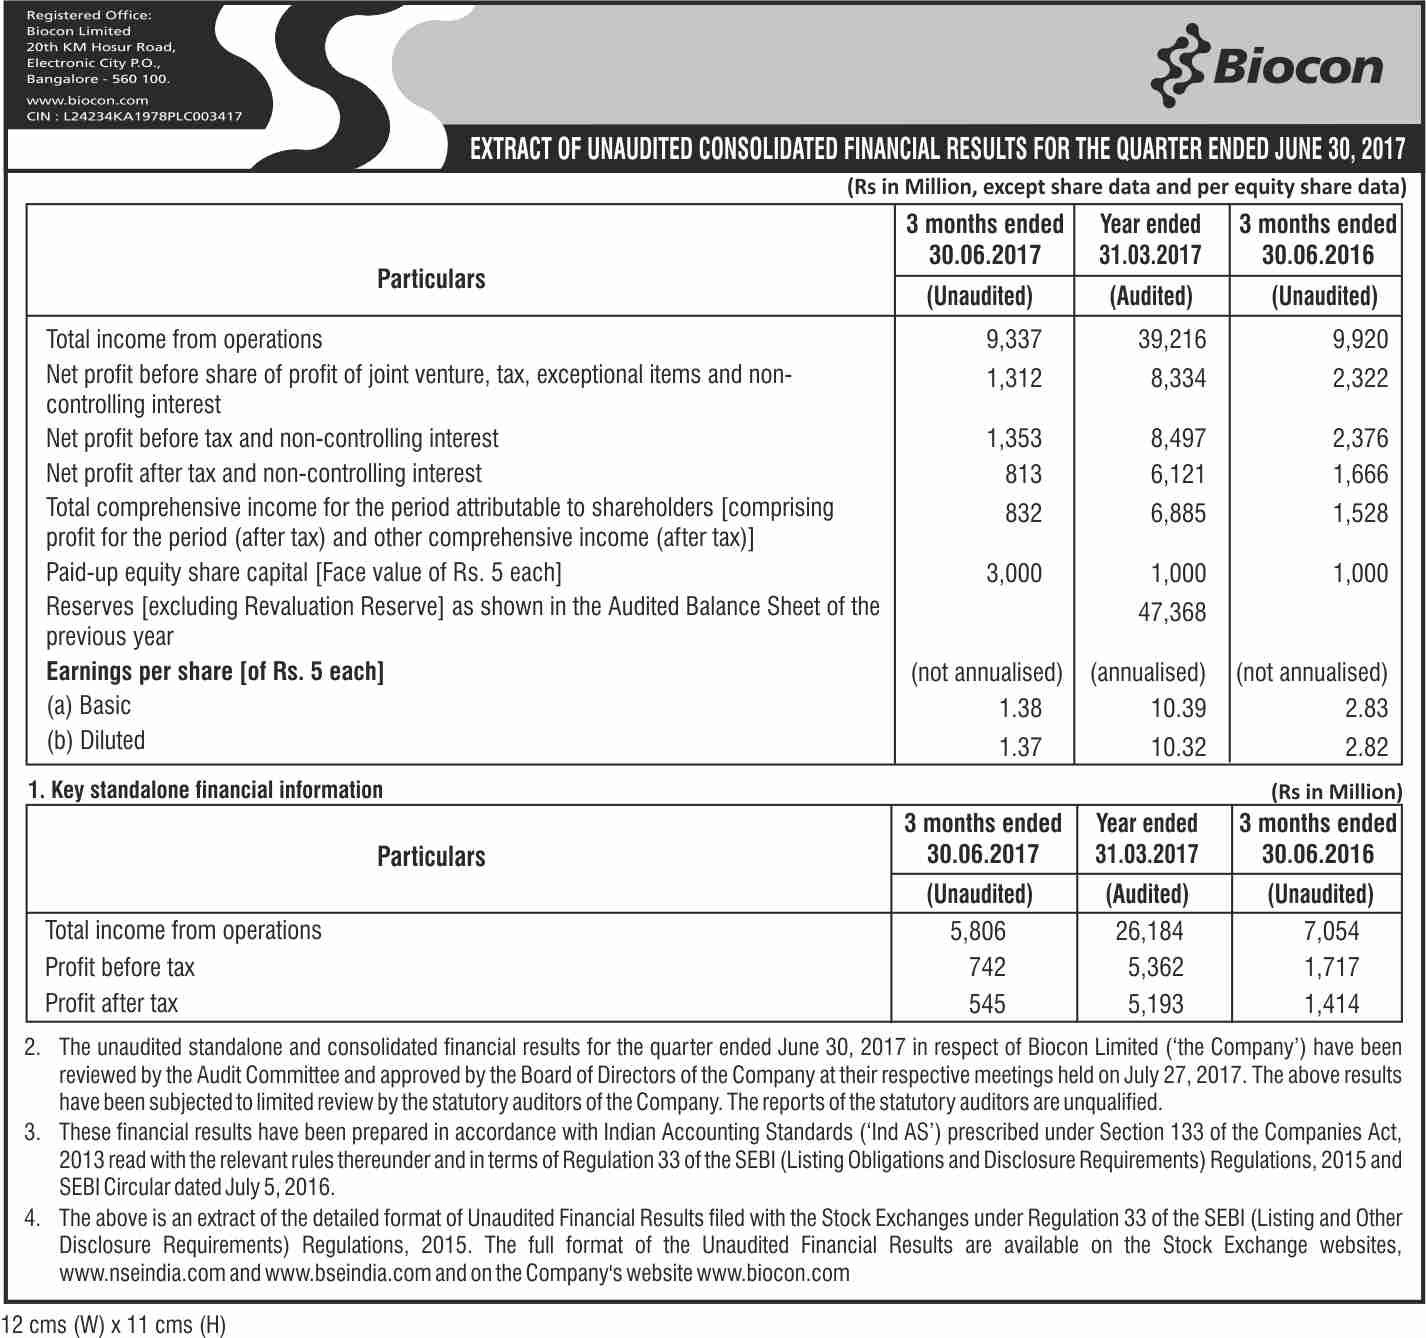
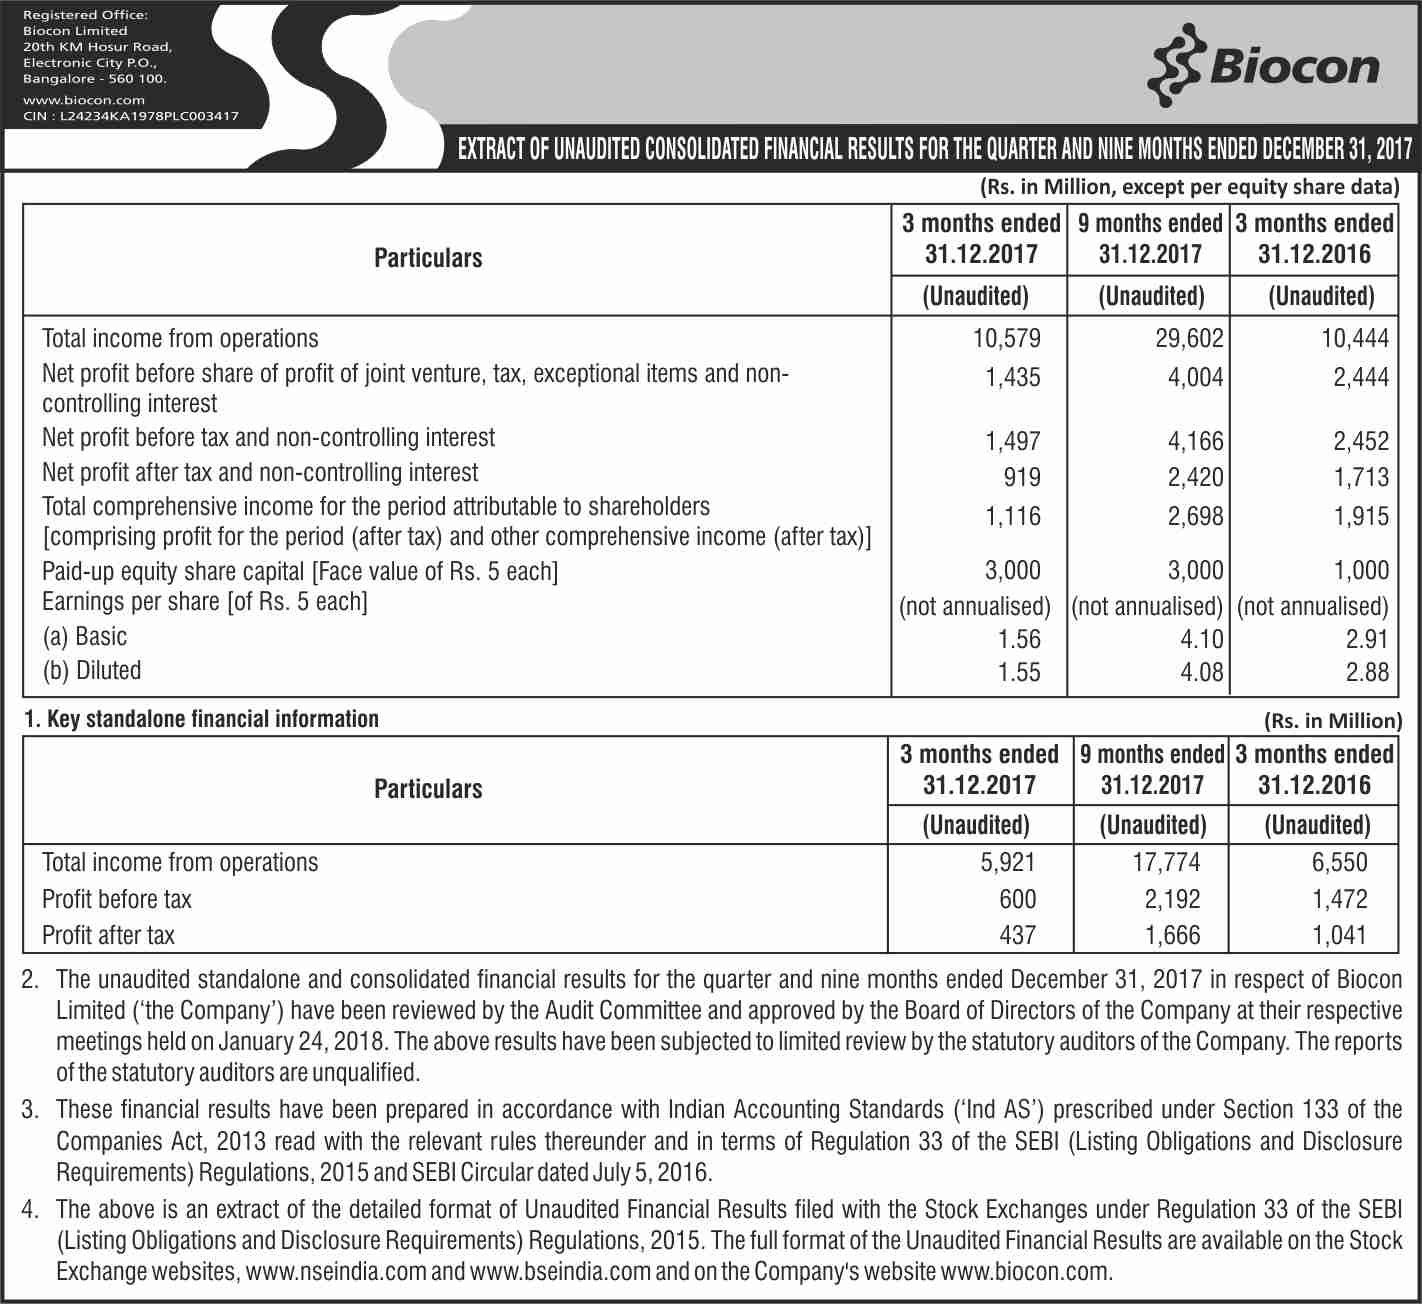
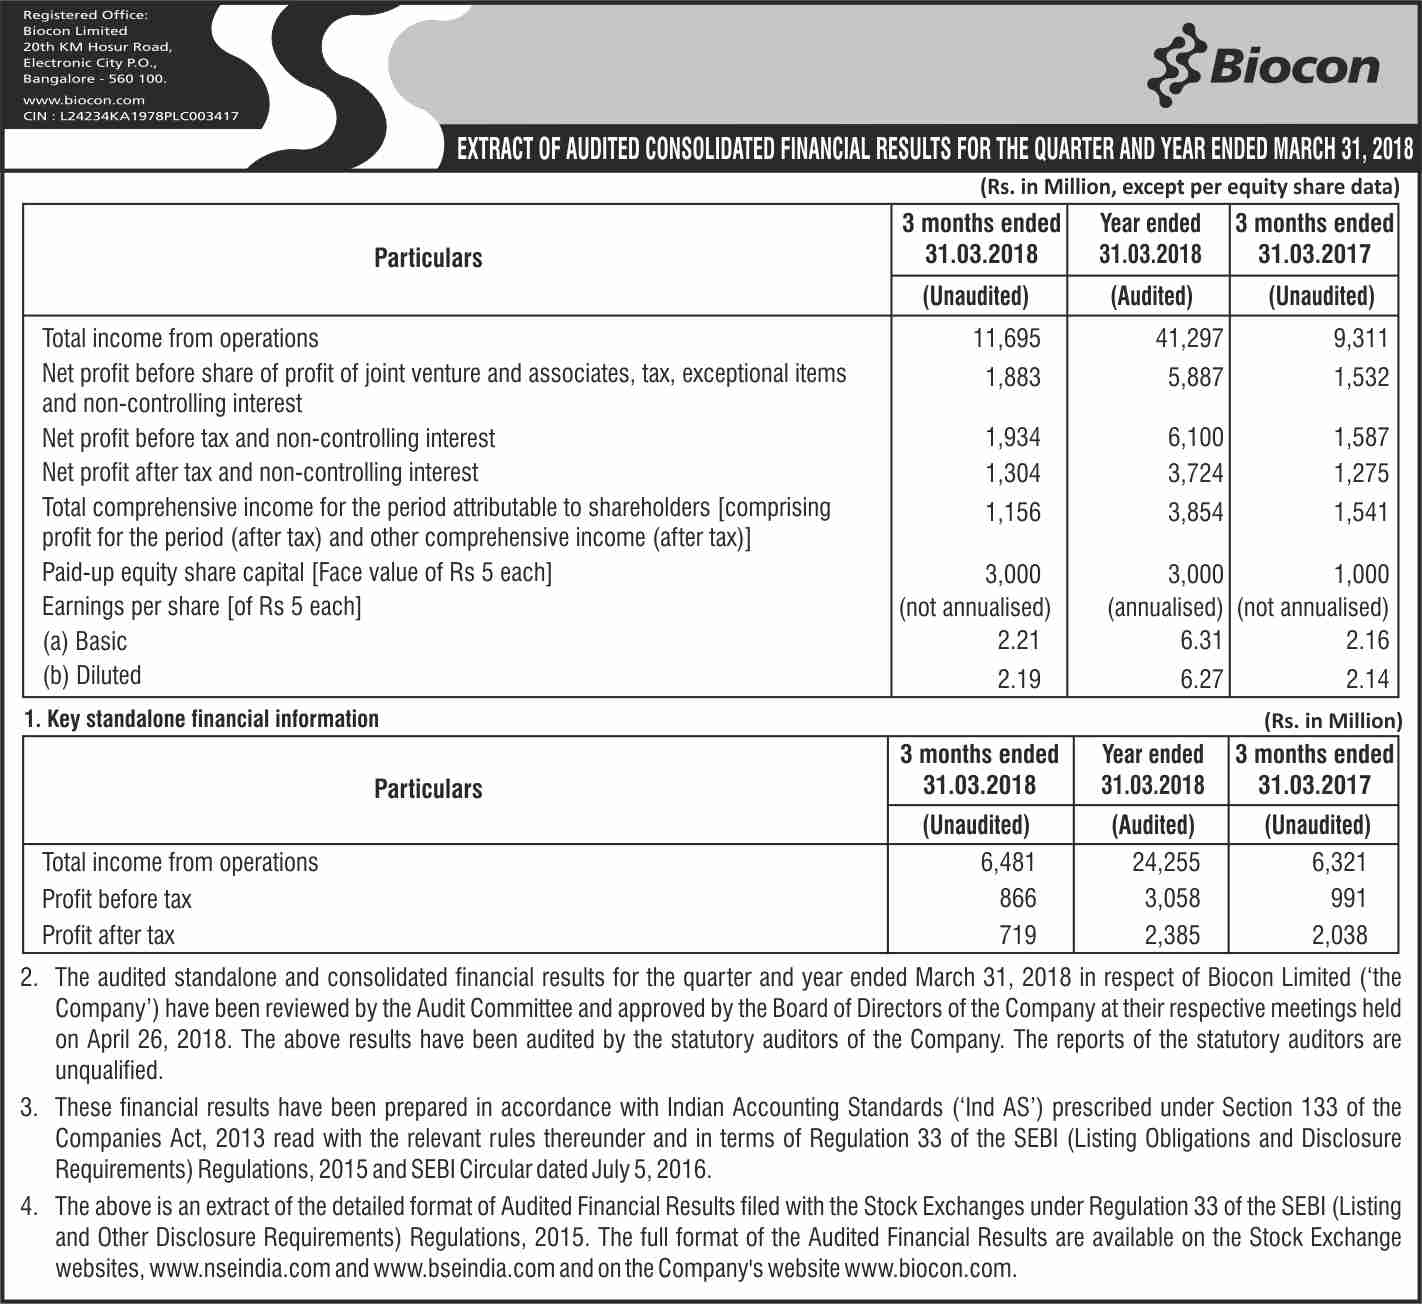
| Newspaper Advertisement |
|
|
|
|
| Results |
|
|
|
|
| Investor Presentation |
|
|
|
|
Consolidated Financial Performance (FY2018-FY2017)
| As per IND-AS In Rs Crore, except growth numbers |
| Particulars |
FY18 |
FY17 |
| Income |
|
|
| Small Molecules |
1,508 |
1,641 |
| Biologics |
770 |
702 |
Branded
Formulations |
612 |
549 |
| Research Services |
1,423 |
1,193 |
| Inter Segment |
(183) |
(163) |
| Revenue from operations* |
4,130 |
3,922 |
| Other Income |
206 |
157 |
| TOTAL REVENUE |
4,336 |
4,079 |
| EBITDA |
1,035 |
1,137 |
| Interest and Finance charges |
61 |
26 |
| Depreciation & Amortisation |
385 |
277 |
| Exceptional Item (Net) |
|
(8) |
| PBT |
610 |
850 |
| Net Profit |
372 |
612 |
| R&D Expenses in P&L |
216 |
267 |
| Gross R&D Spends |
380 |
402 |
| EBITDA Margin |
24% |
28% |
| Core EBITDA Margin |
27% |
32% |
| Net Profit Margin |
9% |
15% |
| *includes Licensing Income |
23 |
145 |
| Notes: Figures above are rounded off to the nearest Cr; % based on absolute numbers. |
Year 2017-18 Financial Highlights
| In Rs. Crore |
| FY 17-18 |
Q1 |
H1 |
9M |
FY |
| Revenue |
988 |
1019 |
1092 |
1237 |
| EBITDA |
246 |
233 |
256 |
300 |
| Net Profit |
81 |
69 |
92 |
130 |
| R&D Expenses in P&L |
58 |
54 |
53 |
51 |
| Total R&D Spends |
96 |
93 |
94 |
98 |
| EBITDA Margins |
25% |
23% |
23% |
24% |
| Core EBITDA Margin |
29% |
27% |
27% |
26% |
| Net Profit Margins |
8% |
7% |
8% |
11% |
| |